
To work in my group, you need to demonstrate yourself to be significantly above average among your peers: you need to undertake one of the following challenges and submit the results to me. If they're not correct... no problem, I give second chances. You're also allowed to ask questions, but try to keep them to a minimum. The primary criterion by which you will be judged is how well you can perform, and then write up, these tasks independently, without much help.
In all cases you need to tell me how much longer you'll be at UCI (ie., if you're an undegrad senior and this is your last quarter... we need to find something short for you to do--not always easy), submit a PDF write-up, with histograms or figures plotted. I don't need your code. I want to see your write-up including a description of you did, and why, and your results with commentary. THIS IS JUST AS MUCH A TEST OF YOUR COMMUNICATION SKILLS AS CODING. Doing research requires critical thinking and the ability to explain your rationale for what you did AND WHY. Without that your code or blind results are worthless.
I have several projects running. You only need to do ONE of the below challenges, depending upon which project you're interested in working on. You need to do the task, and then write it up nicely, with graphs or plots to illustrate your answer. You should be able to do the task within about a week at most, but the answer has to be GOOD. If you hand in a GOOD solution later, that's better than a crappy solution earlier. In other words, a good solution is required, but faster is better than slower.
Let me know if there are any ambiguities, but your job is to do this task with as little supervision from me as is possible.
Unless otherwise specified below, please direct all questions to me at whayes@uci.edu.
You can get a brief idea of my active projects by browsing my GitHub Repos. NOTE: Although many of the projects below are biology-related, you don't need to know much biology to participate. The biology can mostly be abstracted away into mathematical, geometrical, statitical, or algorithmic concepts.
The left side shows frames from a real video of a growing bacterial colony; the right frame shows our algorithm tracking the growth and motion of each individual bacterium during its whole life cycle from being born, moving, growing, to splitting into two daughter cells. Biologists need to track cells in video frames for many purposes, including tracking the growth of cancer cells, learning about the growth of embryos, learning how bacteria move, learning how genetic changes to a cell result in functional changes during it's lifetime... it's a huge research area. Although there already exist several cell tracking algorithms out there, we are working on a novel approach that seems to have several advantages. In order to join this project, your task is to take the above animated GIF, and automatically estimate the number of bacteria in each of the frames, and produce a text file whose only output is one integer per line, representing the count, and the number of lines should equal the number of frames. You only need to use one of the two sides. You can use any language you want, and any method you want, as long as it's automatic, and you wrote it yourself (cite any references you use). Describe your algorithm and the output, and send your PDF write-up to me by email. Extra work for those who already have an undergrad degree: You must create two algorithms, one that can handle each side of the above image. Compare the results and explain any differences.
Alternatively, if you prefer "library" type (reading and writing) research, use Google Scholar to look up and describe everything you can find out about cell tracking that has been published in the last 2 calendar years. (For example, if it's now 2018, then click "since 2017" on the left-hand side toolbar in Google Scholar and see what you can find.) There is no set number of words or pages, but you should describe all relevant work that has happened in cell tracking in the designated time period, devoting at least one paragraph to each paper you find.

Extra work for those who already have an undergrad degree. Read the GRAAL paper and count the number of graphlets of size 3 in all the networks.
Alternatively, if you prefer "library" type (reading and writing) research, use Google Scholar to look up and describe everything you can find out about biological network alignment that has been published in the last 2 years (ie., if it's 2021 now, then include 2020 and 2021). There is no set number of words or pages, but you should describe all relevant work that has happened in biological network alignment in the designated time period, devoting at least one paragraph to each paper you find.
Challenge: To start working on this project, read up on the Amber molecular dynamics system and any one of the tutorials. Then attempt to install Amber on a system of your choice, and describe the difficulties you encounter, and suggest some ideas on how to overcome them. (Installing Amber is challinging, so a successful installation isn't required for the challenge... though if you succeed that would be really impressive!)
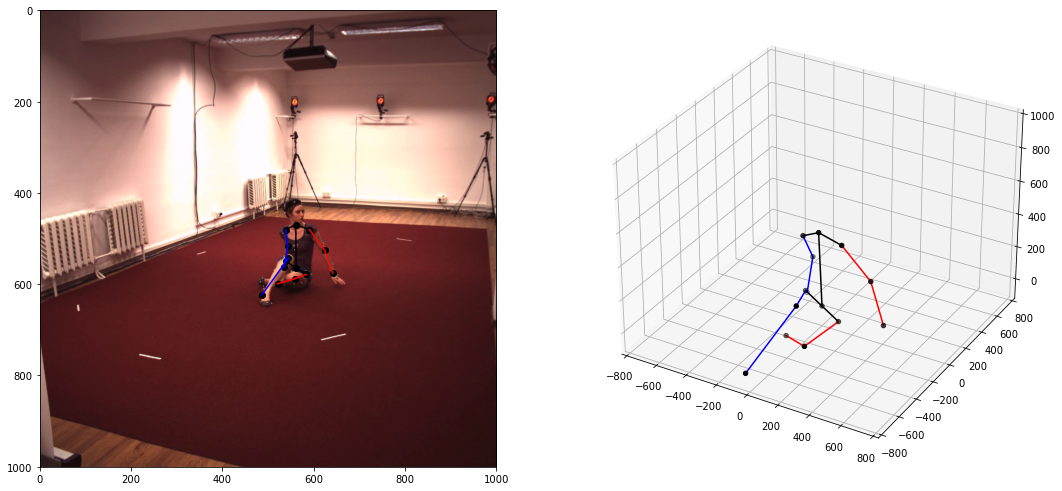
Estimating a person's "pose" (ie., the relative location of their limbs represented as a "skeleton") from a 2D image has many applications and is an active research area. There are many distinct data sets: each uses a different camera, different people, and in a different location; there are even slighly different skeletal representations between datasets. Unfortunately, the vast majority of published papers pick just one dataset (or create a new one), and then perform both training and testing of their method on just that one dataset; virtually nobody has tried training on one dataset and then testing on another--which is an absolute requirement if these systems are be leveraged in the "real world" where every user has a different webcam or phone camera. In this project we have a preliminary working method that works across datasets; our problem is testing it across the largest set of possible input datasets, due to the above differences between datasets. Your task in this project is to help us gather all the existing datasets and algorithms and prepare them for testing under our system.
CHALLENGE QUESTION: Although the actual project uses AI/ML, this challenge has no such element and is purely a geometrial problem. The ZIP file Pose.zip contains 20 images (in the subdirectory "frames") along with some text files. These files are: focal.txt, which contains the focal length of the camera (in mm); joint-names.txt, which contains the list of joints (second column) and their integer IDs (first column). You'll note that there are 14 joints, numbered zero through 13. In the real world, joints have 3D positions, so an actual pose must have 3 coordinates for each joint, for a total of 42 values. Finally, the file poses.txt contains a list of 20 poses, in order of the images in the frames directory. Each line contains 45 columns: the first 3 are the camera position in world space; the remaining 42 columns are 14 triplets of (x,y,z) cordinates of the joints in the order listed in joint-names.txt. Your goal is to write a program (language of your choice) that, for each of the 20 images: (a) finds a suitable camera orientation that points to the subject from the camera position in the first 3 columns of poses.txt; (b) project the 3D skeleton onto a 2D image resembling the right side of the sample pose above. NOTE: In the image displayed on this page, the right side is a 3D pose in 3D co-ordinates, and on the left the 2D projection of the limbs is overlayed onto the image. Your 2D projection should look like that as well, except you can plot them on a white background rather than overlaying onto the photograph. In addition to providing the 2D projection images, please accumulate all of the 2D co-ordinates used into one table so we can easily verify your 2D co-ordinates. NOTE: if you already have a degree (eg., B.Sc.), then you must also (c) superimpose your skeleton onto the image in the frames directory, as we've done in the left half of the sample image above. (Note that this step is nontrivial and not required, since the camera position, scale and center of your image and the input frame may not be exactly the same---look closely at the sample image and you'll see that even though the pose is correct, the camera viewpoint in the real and reconstructed image are not exactly the same.) Please direct questions for this challenge to my Ph.D. student Saad Manzur.
2) If you want to work in the Galaxy Image Analysis project, then you should start by playing around with any galaxy images you find on the web and putting them into the SpArcFiRe webpage. Once you get the hang of it, you have two choices:
(A) find an image of NGC5054, or take the one from my paper with Darren Davis (cited on the above web page), and try to find a set of SpArcFiRe options on the website that can find the "dim" arm on the right hand side of the image of that galaxy in the above paper.
(B) Go get the following file: here Each row is some data about a galaxy, and the columns have names in the top row. You don't need to know what all of the columns mean, but pay attention to these ones: P_CS: the probability that this galaxy is a spiral. numDcoArcsGEXXX for various values of XXX: the number of discovered arms in that galaxy that are longer than XXX. Your task is to plot a histogram of the number of spiral galaxies with N or more arms of length XXX, for each of the XXX values in the file. It would be best to plot all the histograms on one figure to be easily able to compare them to each other. What value of P_CS did you choose?
Alternatively, if you prefer "library" type (reading and writing) research, use Google Scholar to look up and describe everything you can find out about automated galaxy classification that has been published in the last 2 calendar years. (For example, if it's now 2018, then click "since 2017" on the left-hand side toolbar in Google Scholar and see what you can find.) There is no set number of words or pages, but you should describe all relevant work that has happened in automated galaxy classification in the designated time period, devoting at least one paragraph to each paper you find.
Extra work for those who already have a degree: Tell me about your astronomy and/or physics background.