Homework in
Visual Data Mining

Homework in | Visual Data Mining | |
To experience the potential of data visualization, you are asked to explore data sets with a visualization tool and to make interesting findings. You may use any visualization system for multidimensional data that we discussed in class, and you may also use any data set that you find interesting (unless it is too small to merit visualization). For your convenience I collected a few systems and data sets below but, again, you may use others as well.
Visualization tools:
Eureka, InfoZoom and Spotfire are available in the HCI/CSCW lab (this is room 100 in building ICS2). Just drop me a note or come by my office, so that I can unlock the door for you.
Restricted evaluation versions of Eureka and InfoZoom are also available from the following addresses:
Data sets:
see http://www.ics.uci.edu/~kobsa/courses/ICS280/datasets
(for the time
being, do not use Loans.txt and Medical.txt)
Your task is to make seven findings in one or more datasets using one visualization tool. Please describe each finding and the reason why you find it interesting (in not more than 5 lines). Include a sceen shot which shows how your finding manifests itself in the visualization (do not include a copy of the whole sceen, if possible, but only of the screen area that contains your discovery).
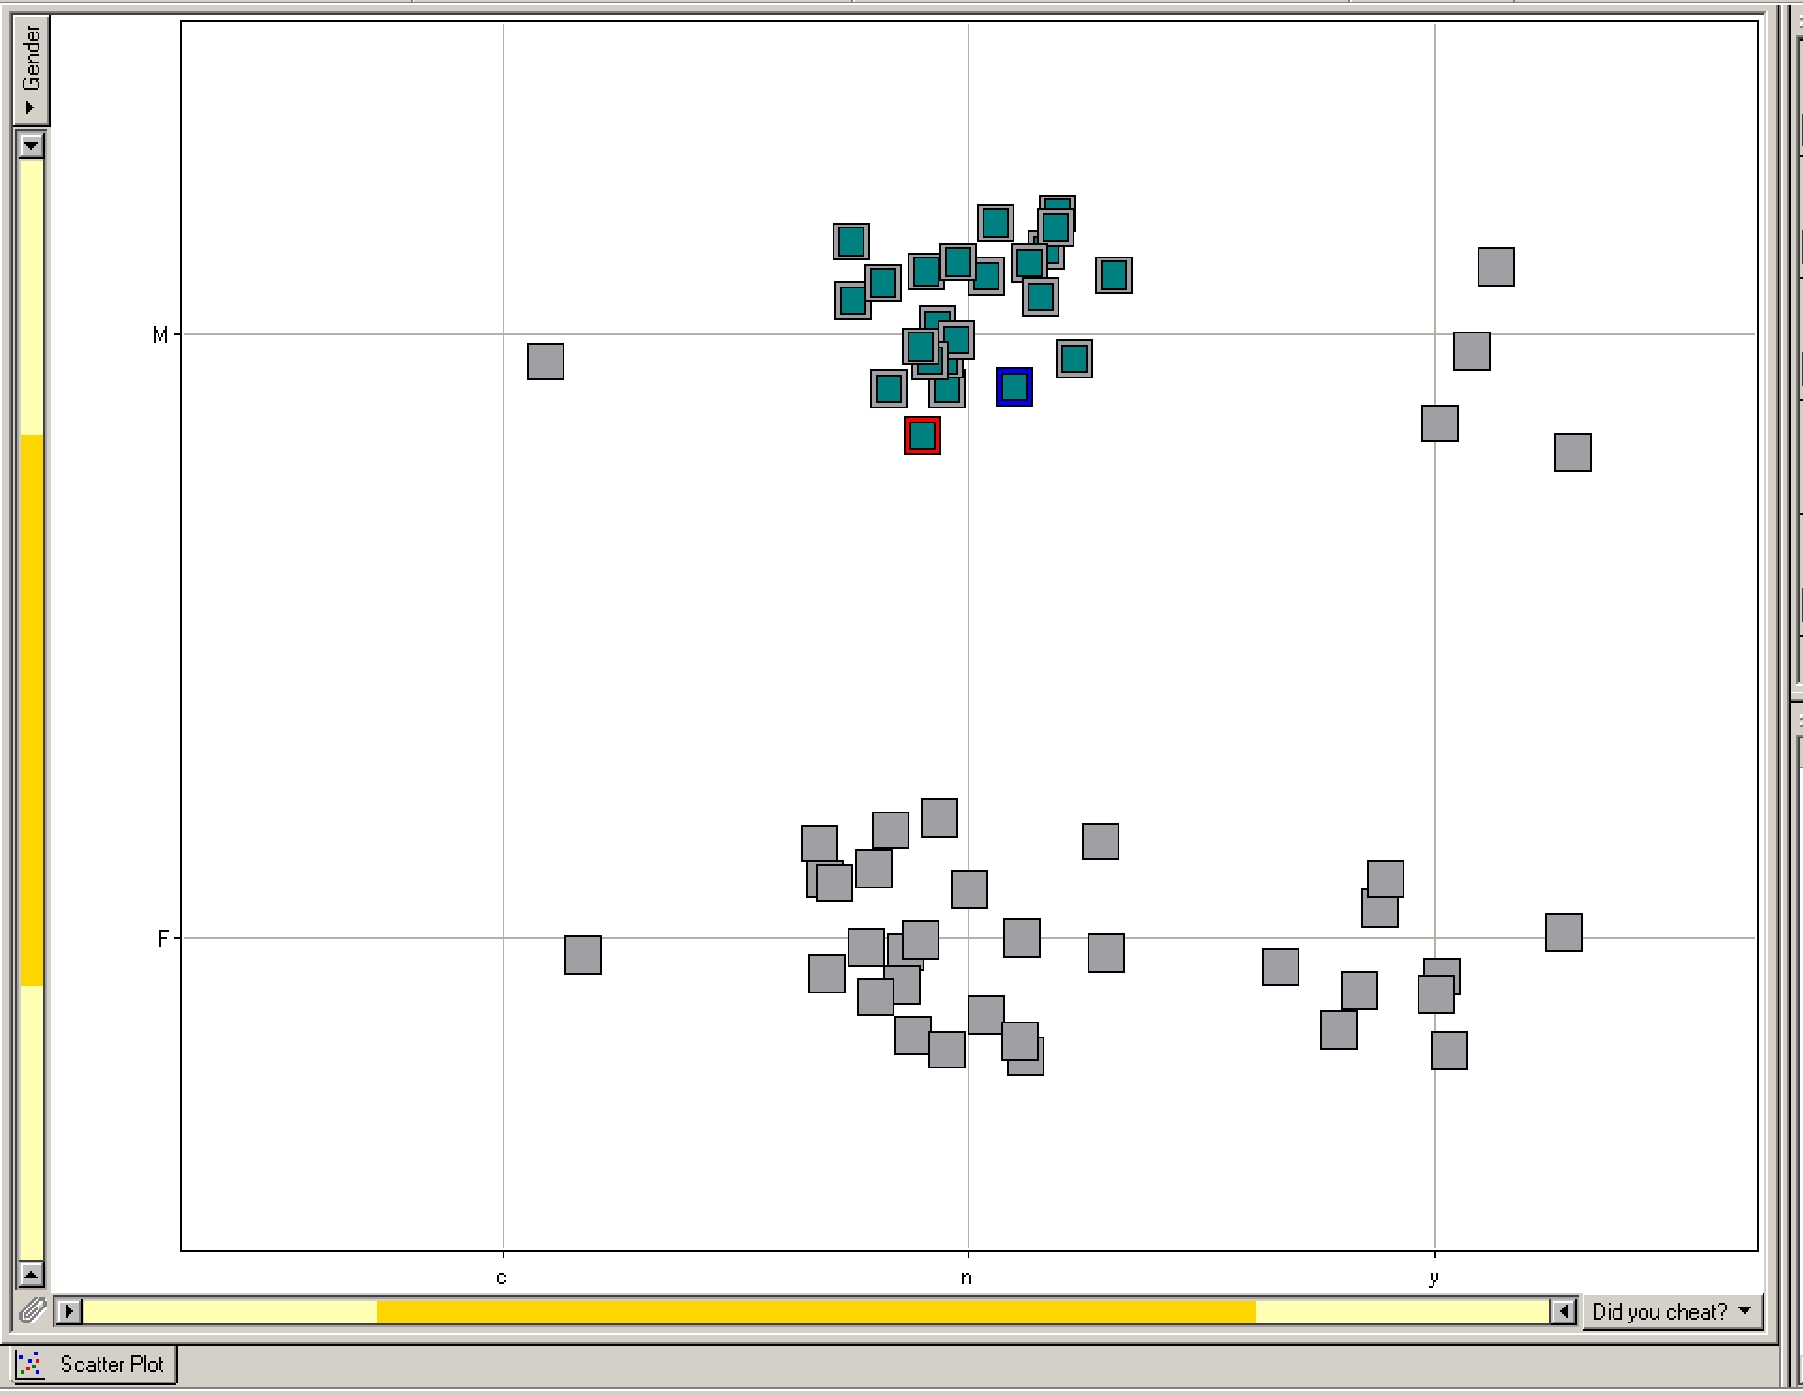
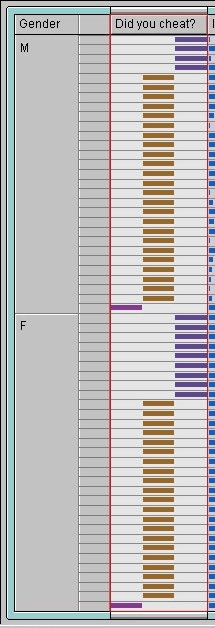
Here is an example of discription of a discovery: "In the file dating.txt, I found that girls reported more frequently than guys that they had cheated on their partners in the past. I find this interesting since I had thought that guys would cheat more. To wit, the finding could mean that girls really cheated more, or that they were just more honest.Below is how my finding looked like in Eureka/InfoZoom/Spotfire"
 |
|
|
|
Moreover,
please describe briefly your experiences with the visualization tool that you
used (like problems that you encountered, features that you missed, improvements
that you suggest). This part can also be quite brief (like 1/2 page, depending
on how much you have to say).
 Eureka