Learn how to create a Map U/I from dynamic real-time data
The goal of this assignment is to use a Mapping UI toolkit to display real-time data in a web-based UI.
Task (5 - 10 hours)
- This is a solo assignment
- Use Google Maps v3 (API Reference)
- Embed a Google map into a copy of the webpage from the real-time web assignment
- Make a copy of the webpage from the real-time web assignment and work on the copy so that you don't mess up the grading of the real-time web assignment
- After your AJAX call returns, collect the geo-data from your data source and
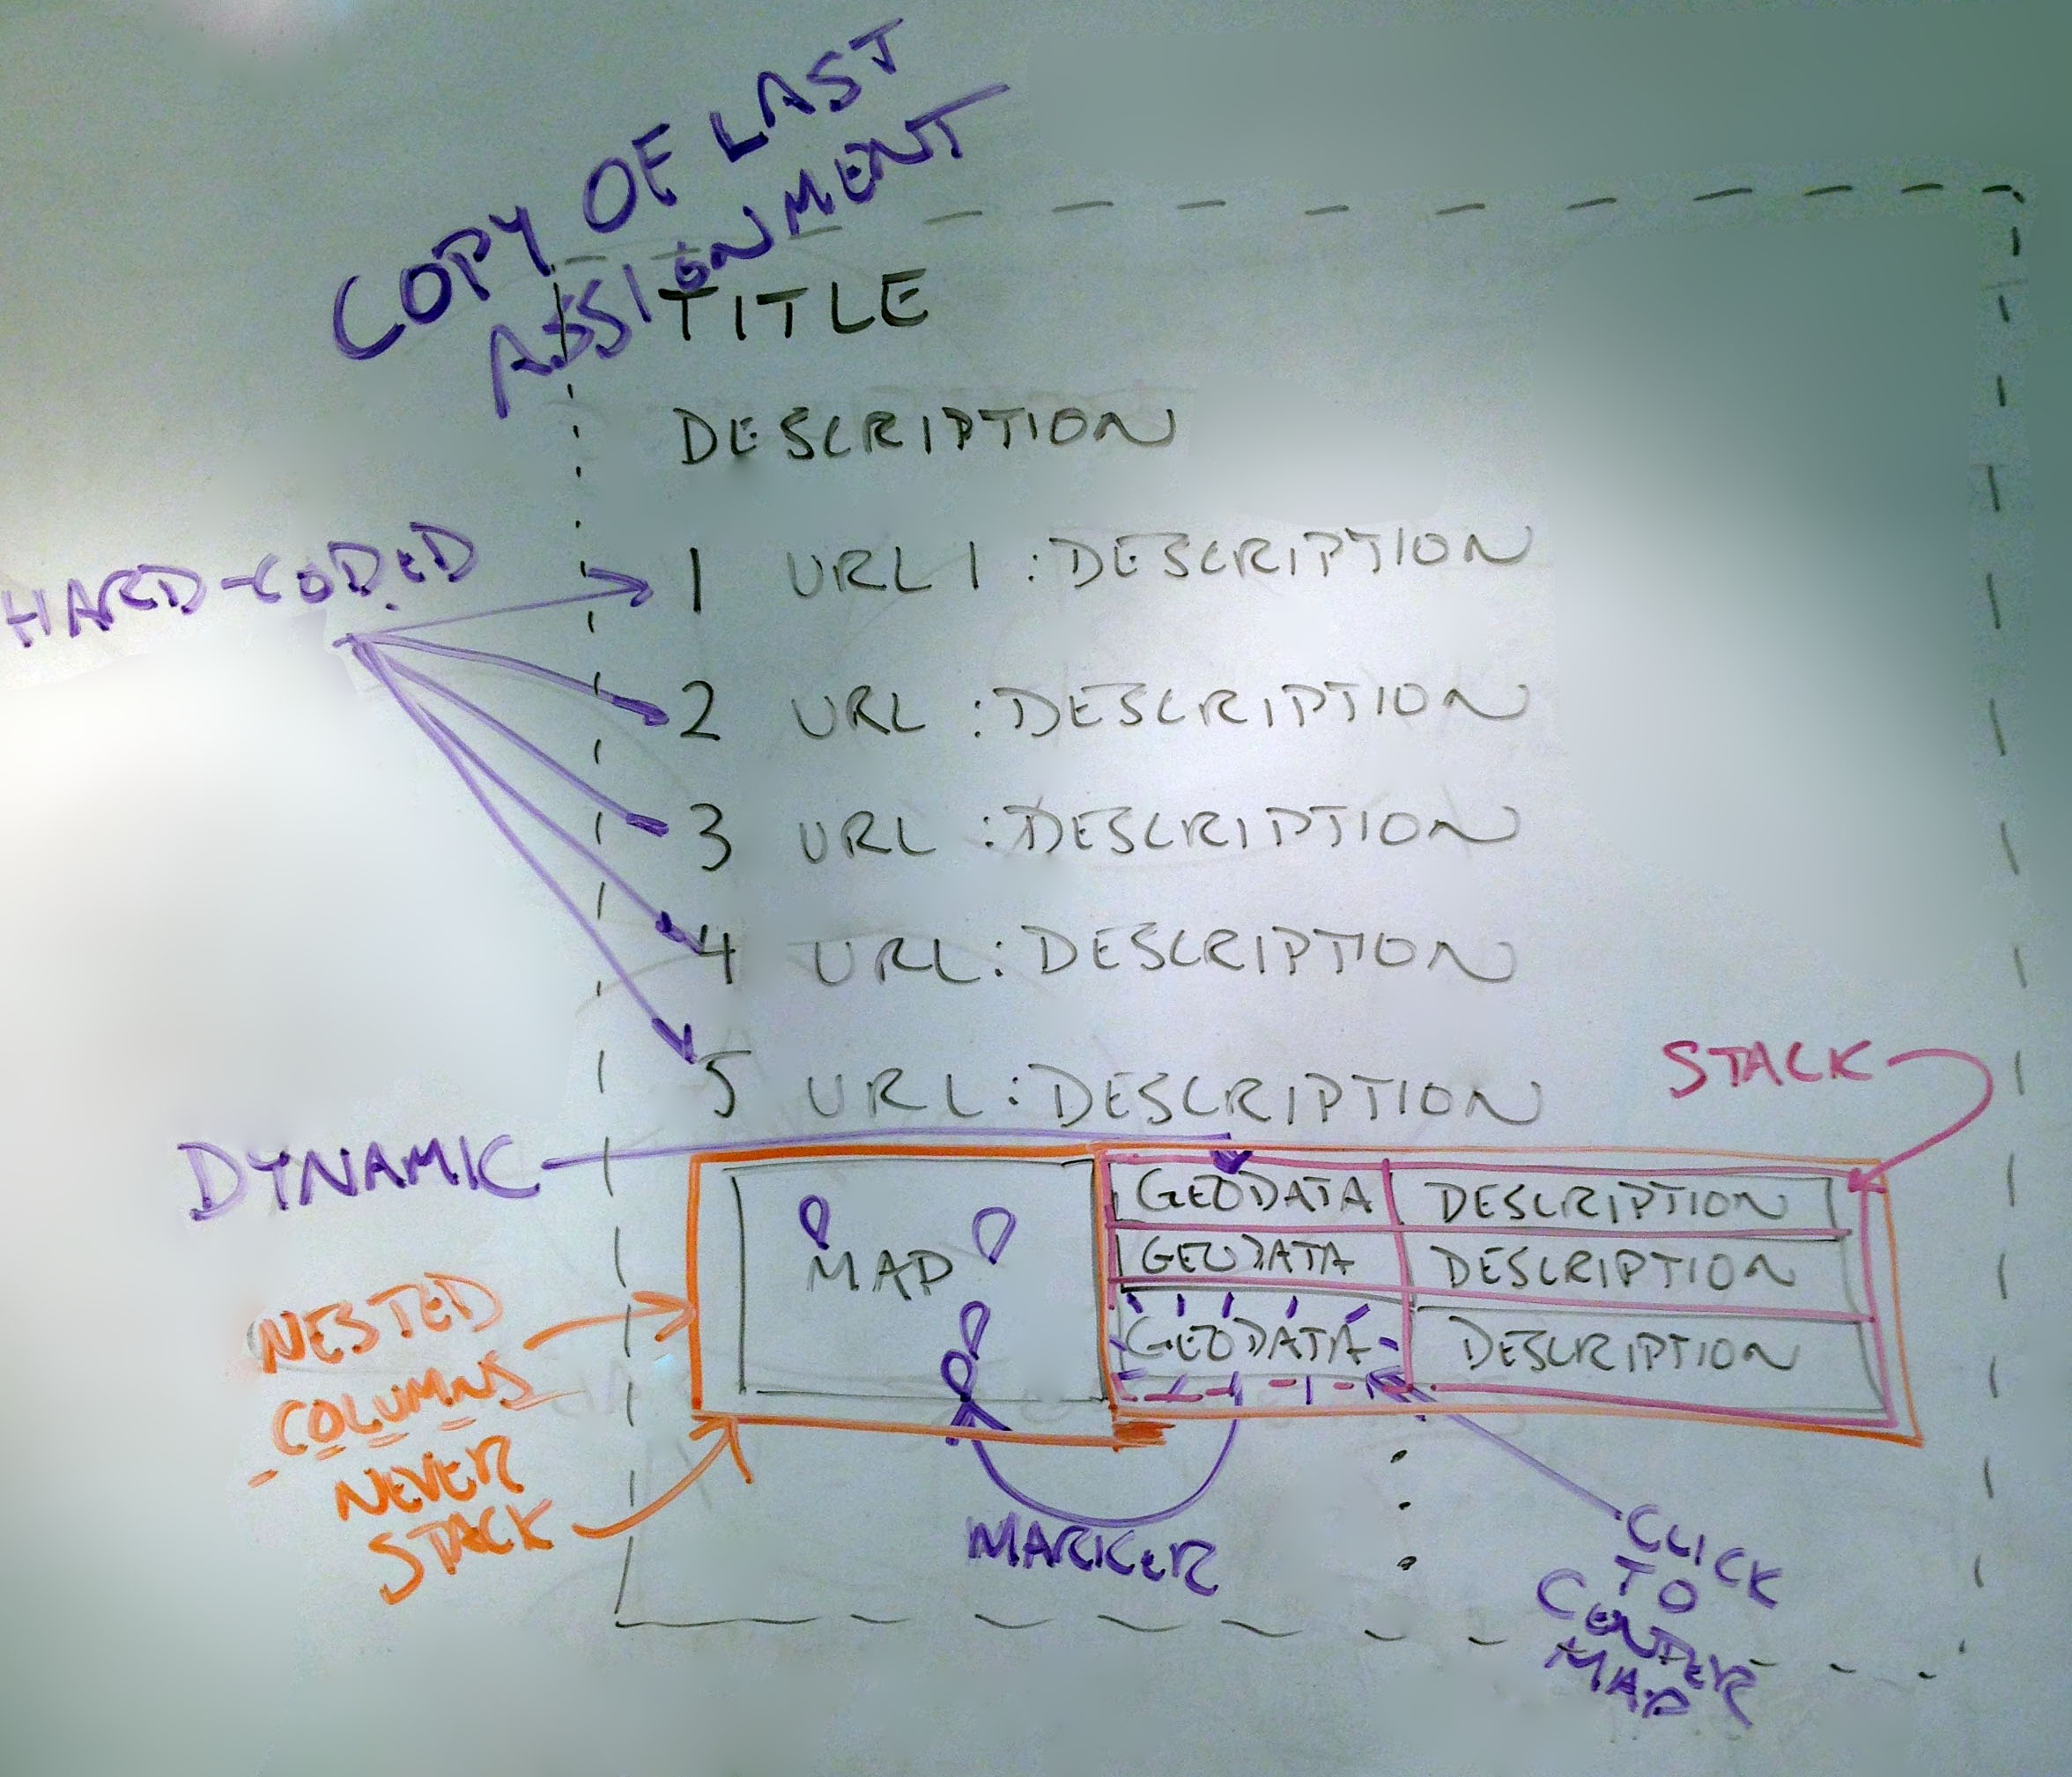
- Plot the geo coordinates onto a map interface next to your table.
- Enhance your table elements so that clicking on the text (or a link nearby) will center the map on that location.
- Add a nesting responsive structure so that the map element and the text elements are always side-by-side regardless of the size of the screen, but allow the text elements to stack within their container as the screen gets smaller
- Enhance the map in one interesting way of your choice. For example:
- Make different types of locations have different icons on the map
- Program a context-menu at each location upon right-clicking the map icon with relevant options for that location (e.g., Directions to here, Wikipedia links, Flickr Images, etc.)
- Add a paragraph to your webpage justifying the enhancement that you made
- Turn in your assignment using the EEE quiz which will have one question for the URL of your webpage https://eee.uci.edu/quiz/1TKx973O96
Suggested steps for how to accomplish this:
- Make a copy of all the files from the previous assignment
- Verify the new files work in a browser
- Plan what you want to do and what you want the web page to look like
- Create a container for the map
- Add the responsive elements to create the nesting structure
- Add code to load the map
- Add code to load the markers
- Add code to center the map
- Add your extra map element
Approximate grading rubric:
- -5 no description of enhancement
- -5 not plotting markers automatically
- -15 for no rows/columns, but other things working
- -5 for plotting random locations
- -10 not having a map enhancement.
- -10 for not having a functional button to center the map on the individual markers
- -2 for http -> https or vice versa problems
- -10 for not having responsive behavior that matches the description
- +40 turning in something that doesn't look different from real-time web assignment